Standard Deviation Differences Between Excel and R (and my code in Cube Voyager)
July 24th, 2015I had a need to get the correlation of count to assignment in Cube Voyager. I don’t know how to do this off the top of my head, and I’m instantly mistrusting of doing things I’d normally trust to R or Excel. So I looked on Wikipedia for the Pearson product-moment correlation coefficient and ended up at Standard Deviation. I didn’t make it that far down on the page and used the first, which generally made Voyager Code like this:
I left the print statements in, because the output is important.
Avg AADT_TRK = 1121.77
Avg VOLUME = 822.03
n = 230.00


sdx1 = 1588160175
sdy1 = 1196330474
n = 230.00
sd AADT_TRK = 2627.75
sd Volume = 2280.67
r2 = 155.06
Note the standard deviations above. Ignore the R2 because it’s most certainly not correct!
Again, mistrusting my own calculations, I imported the DBF into R and looked at the standard deviations:
> sd(trkIn$AADT_TRK)
[1] 2633.476
> sd(trkIn$V_1)
[1] 2285.64
Now Standard Deviation is pretty easy to compute. So WHY ARE THESE DIFFERENT?
Just for fun, I did the same in Excel:
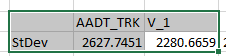
So I started looking into it and recalled something about n vs. n-1 in the RMSE equation and discussion in the latest Model Validation and Reasonableness Checking Manual. So I decided to manually code the standard deviation in Excel and use sqrt(sum(x-xavg)^2/n-1) instead of Excel’s function:
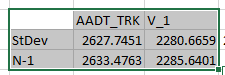
It’s not that Excel is incorrect, it’s not using Bessel’s Correction. R is.
/A


You must be logged in to post a comment.