August 11th, 2016
Occasionally, I do screen captures. Â I use the Microsoft Expression Encoder. Â It’s not pretty, but I think it’s free. Â The output, by default, is a WMV (Windows Media Video) file.
YouTube is perfectly okay with WMV files. Â However, for an animation to show up in Twitter, it has to be an animated GIF with a limit of 5 MB.
Enter ImageMagick:
convert -resize 50% -deconstruct -layers optimize inputFile.wmv outputFile.gif
This took a 14-20 MB animated GIF (uncompressed) to 1.36 MB. Â Which is nice, because then I can show gems like this:
https://twitter.com/okiAndrew/status/763819198875402244
Cheers!
April 29th, 2016
In any iterative process, it is nice to see progress.
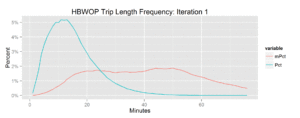
Recently, it was gravity model distribution (again), so I had a process in R to calibrate friction factors, and part of it exported the trip length frequency chart:
ggsave(paste("TLF", Purpose, Period, "_Iter", iteration, "plot.png", sep=""))
So I was left with 30 charts showing progress. Â So for kicks (a little), I animated the charts using ImageMagick:

One of the charts. Click for larger and animated.
To do this, you need Imagemagick (scroll down for Windows) and the following command line:
convert -resize 75% TLFHBWOP_Iter%dplot.png[1-30] HBWOP.gif
The resize parameter is optional, I used it to reduce the image size down to something allowable by Twitter.
You must be logged in to post a comment.